Tracking and tracing in Microsoft's WF4
The software my company offers includes, among many other things, workflows based on Microsoft’s Windows Workflow Foundation (WF4). These workflows are activated and resumed by WCF calls. That is, the workflows act as services and are hosted in the IIS. Every few months, I need to diagnose some tricky problem in such a workflow, and I cannot debug on customers’ systems. There are two .NET-mechanisms that can help here, “tracking” and “tracing”. Each time I face such a customer problem, I have to think anew which of those two mechanisms I should use, so I decided to write this up once and for all. As a good citizen, I put this on my blog, in case it might help someone else.
I will be pragmatic and just give examples. For theory and background, you can check the links at the end of this post.
Tracking
Tracking is specific to workflows. It can be enabled without changing application code. To enable it, we add an “etwTracking” element to the configuration file, as in the example below. Optionally, we add a “tracking” element that allows us to specify what we want to track and how. From the many possibilities, I have chosen “activityStateQueries”, which allows us to track a workflow’s inner activities.
<system.serviceModel>
  ...
  <behaviors>
    <serviceBehaviors>
      ...
      <behavior>
        <etwTracking profileName="MyTrackingProfile" />
      </behavior>
    </serviceBehaviors>
    ...
  </behaviors>
  <tracking>
    <profiles>
      <trackingProfile name="MyTrackingProfile">
        <workflow activityDefinitionId="*">
          <activityStateQueries>
            <activityStateQuery activityName="*">
              <states>
                <state name="*"/>
              </states>
              <variables>
                <variable name="*"/>
              </variables>
            </activityStateQuery>
          </activityStateQueries>
          ...
        </workflow>
      </trackingProfile>
    </profiles>
  </tracking>
<system.serviceModel>
A more complete tracking profile, with interesting extra options, is in the “Links” section below.
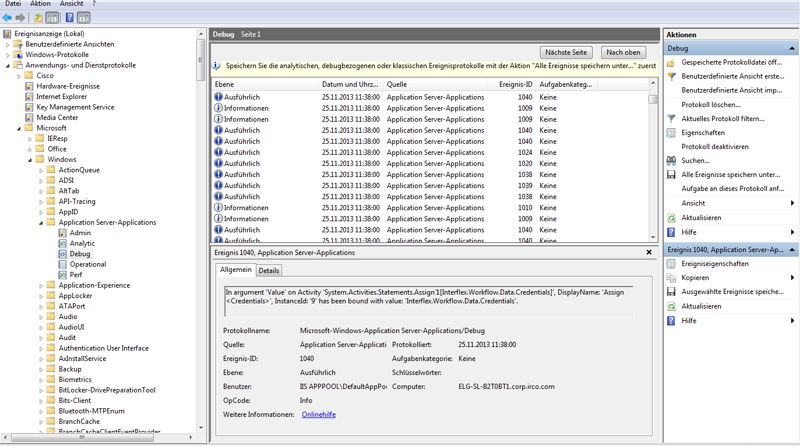
The tracking data can be viewed with Microsoft’s “eventvwr.exe”, which exists on customers’ machines. Running the tool on the tracking data will result in something like this:

To make this work, we first need to right-click on “Application Server-Applications”, and chose “View > Show Analytical Protocols”. Otherwise, we won’t see the “Debug” protocol which contains the tracking data. Finally, we can browse through the events. In the screenshot, we have picked a variable-binding event, as can be seen in the bottom pane. If the variable’s were of basic type, like “int”, we would see the variable’s value. Unfortunately, for complex types like our class “Credentials”, the properties of the object are not displayed. Maybe they can be displayed with a “Custom Tracking Participant” as introduced in the “Tracking Participants” link at the end of this post. More generally, Custom Tracking Participant provide a way to go beyound the out-of-the tracking capabilities. The downside of Custom Tracking Participants is that they must be implemented by the user.
Tracing
Unlike tracking, tracing is not specific to workflows. It too can be enabled without changing application code, and also produces events viewable with “eventvwr.exe”. But it has a great extra option that helps understanding the interplay between workflows and their environment. To use this option, we must first direct the tracing output into log files. This can be done by inserting something like the following code into the application’s configuration file, as a child of the <configuration>-element. In our case, that file is the “web.config” of the workflow application hosted in the IIS. One can trace various sources, employ various listeners, and hook up each source with some of those listeners. Consider this configuration code:
<system.diagnostics>
  <sources>
    <source name="System.ServiceModel" switchValue="Information, ActivityTracing" propagateActivity="true">
      <listeners>
        <add name="myTraceListener" />
      </listeners>
    </source>
    <source name="System.Activities" switchValue="Information">
      <listeners>
        <add name="myTraceListener" />
        <add name="myTextListener" type="System.Diagnostics.TextWriterTraceListener" initializeData="c:\Windows\Temp\MyTrace.txt" />
      </listeners>
    </source>
  </sources>
  <sharedListeners>
    <add name="myTraceListener"
          type="System.Diagnostics.XmlWriterTraceListener"
          initializeData="c:\Windows\Temp\MyTrace.svclog" />
  </sharedListeners>
</system.diagnostics>
This xml-example specifies two sources: the first one, named “System.ServiceModel”, ensures that we record the WCF traffic that drives the workflows. That traffic includes WCF calls that activate the workflow for the first time, resume it after it went idle, and replies to such calls. The inner workings of the workflow are not recorded. The other source, “System.Activities”, ensures that we record the inner workings – in particular the events when activities inside the workflow are scheduled, started, and completed.
Both sources use the same listener, “myTraceListener”, which is declared in the <sharedListeners>-element. Writing into a common listener helps analyzing the data, as we shall see. The listener is an “XmlWriterTraceListener”, and it writes the output of both sources into the file “MyTrace.svclog” specified in the xml example. Before we analyze the data, note that the second source also writes its data to another listener, “myTextListener”, which is of type “TextWriterTraceListener” and writes unstructured text into the file “MyTrace.txt”. Note that “myTextLister” needs no entry in the <sharedListeners>-element, because it is used only “locally” by the first source.
Caution: the path to the log files must have sufficient access rights so that the logs can be written! If the logs do not appear, the access rights are the first thing to check.
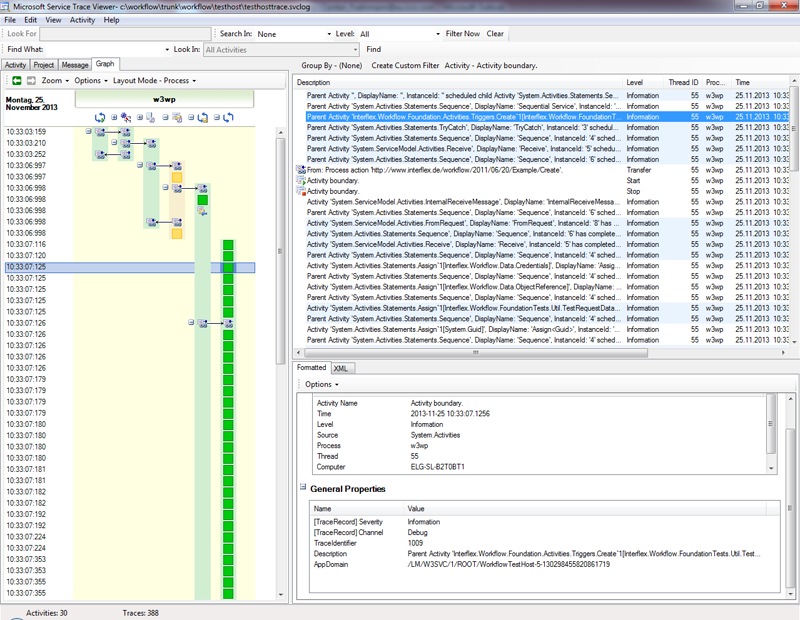
Now let’s analyze the data in “MyTrace.svclog”. It can be viewed with Microsofts “SvcTraceViewer.exe”. That tool is unlikely to exist on customer’s machines. We will probably copy the log file to a developer machine and analyze it there. When we run the tool on the log and switch into the “Graph” tab, we get something like this:

Consider the six vertical columns in the chart on the left. Each square corresponds to a line in the upper-right pane. The details of the highlighted line can be seen in the lower-right pane. Each line comes from one of the two sources. As it happens, the rightmost column in the chart – that is, the column with the many green squares, contains the inner workings of the workflow – that is, the events for scheduling, starting, and completing of the workflow’s internal activities. The five columns on the left correspond to various layers outside of the workflow. The arrows stand for communications – requests and answers. I will spare you the details, but the important thing is: By mixing two sources, we created a chronological chart that contains all events of both sources, and the communications between all layers.
Summary
Tracing gives a great overview of the large-scale interplay between workflows and the environment, plus many details of the workflow execution. Tracking too shows many details of workflow execution, but seems less useful for the big picture. However, tracking can be extended by “Custom Participants” as described in the “Tracking Participants” link below, making tracking potentially more powerful than tracing.
Links
Overview forTracking and Tracing
Tracing
Tracking
Tracking Participants
A more complete tracking profile